
Introduction: The Market Mood Index (MMI) is a very useful instrument. This index gives traders and investors important information by revealing the opinions and feelings of market participants as a whole. We can use this index as a compass to navigate the ups and downs in the market mood. We’ll go over the definition of the Market Mood Index, its methodology, and how using it might improve your investing techniques in this blog post.
Do You Know What Is The Market Mood Index (MMI)?
The Market Mood Index is a quantitative indicator of market sentiment that is often referred to as the Investor Sentiment Index or the Fear-Greed Index. It is a reflection of the general feelings and perspectives that investors have about the financial markets. A quick assessment of the market’s extreme greed or fear can be obtained from the MMI.
It is not a novel idea to gauge market sentiment. Experience, intuition, and knowledge of human psychology have long been trusted by seasoned traders to help them make wise selections. However, it wasn’t until recent developments in data analysis and technology that this idea was formalized into a quantitative index.
The MMI is a composite index that combines different variables, each of which offers a distinct viewpoint on the mood of the market. These indicators include relative strength indicators, moving averages, and technical analysis signals like the CBOE Volatility Index (VIX), which are measurements of volatility. Through the integration of these diverse components, the MMI presents an all-encompassing depiction of investor mood. Check LIVE Market Mood Index 2024.
Some Main Components Of Market Mood Index
1. Volatility Measures: Volatility measures, such as the VIX, which form the basis of the MMI, act as a gauge of market anxiety. An increase in volatility frequently indicates a tense market. In the world of finance, volatility measurements are metrics that are used to measure how much the price or returns of a financial instrument vary over time. They are essential for traders and investors to evaluate the degree of risk involved in a transaction. by the way, volatility is a part of the market.

2. News Sentiment effect: A share market is a sentiment or news base market, so bad or good news creates a (panic) fear or greed situation. Share market news can have a significant impact on financial markets and investments. Good news regarding a business’s performance, market trends, or the overall state of the economy may boost interest in the company’s stock, driving up its price. On the other hand, unfavourable news may cause demand to decline and stock values to fall. Natural language processing algorithms dissect news articles, social media posts, and financial reports to gauge sentiment. The tone and content of these sources can be powerful indicators of prevailing market mood.
3. Put-Call Ratio Analysis: Put call ratio a key indicator in option trading. Within the financial markets, options trading is a dynamic and complex domain that provides investors with a multitude of ways to mitigate risk and profit from market fluctuations. The put-call ratio is a crucial measure for options traders as it offers important insights into market sentiment and possible changes in direction.
The put-call ratio, which contrasts the total amount of put options and call options traded on a particular security or index, is a simple yet effective indicator. It represents the general opinion of options traders about the course of the underlying asset. In its most basic form, a put option gives the holder the choice to sell an asset at a predetermined price that is called a strike price either before or at expiration, but not the obligation to do so.
On the other hand, a call option gives its holder the choice—but not the obligation—to purchase an asset at a fixed price. Analysts can determine whether investors are more likely to take bearish (put options) or bullish (call options) positions by looking at the ratio of put options to call options.
4. Market Breadth Indicators: Breadth indicators assess the Health and Trends of the latest Market trends. Investors and traders use a wide range of tools and measures in the constantly shifting financial markets to help them make well-informed decisions. A subset of these instruments is referred to as breadth indicators. These measurements, which examine the involvement and strength of different components within an index or sector, provide important insights into a market’s direction and general health. The amount of rising and falling assets within a specific market, sector, or index is measured by breadth indicators. They offer a moment in time of the degree of participation of each security.
5. Technical Analysis Signals Identify Market Mood: Technical analysis is the process of forecasting future price movements by analyzing past price and volume data. Technical analysis can offer useful insights for evaluating the sentiment or attitude of the market. The following signs from the technical analysis can be utilized to determine the market mood index. It’s crucial to remember that no indication is infallible and that other types of analysis and risk management strategies should be employed in addition to indicators. Beyond technical analysis, a variety of other factors can also impact market mood, such as economic statistics, news stories, and geopolitical happenings.
How To Use Market Mood Index Calculation For Market Sentiment:
To understand investor sentiment and maybe guide trading or investment decisions, using a “Market Mood Index” would include analyzing its readings. Here’s a general guide on using an index like this. It’s important to comprehend an index’s calculation and purpose before utilizing any. This entails being aware of the elements, data sources, and any particular elements taken into account during its creation.
Throughout time, look for patterns and trends in the index. Does it show times of tremendous highs or lows, or is it generally stable? Trends can assist you in determining changes in market sentiment. Utilize other technical, fundamental, and sentiment indicators in addition to the Market Mood Index. This gives a more thorough picture of the state of the market and aids in signal validation or cross-verification. Even while the Market Mood Index is a useful tool, it’s crucial to not rely solely on it. There are many moving parts in the complicated financial world, and market mood is just one of them. now time to see the Market Mood Index work to identify market sentiment.
(( Be Greedy When Others Are Fearful, Be Fearful When Others Are Greedy ))
WARREN BUFFETT,,
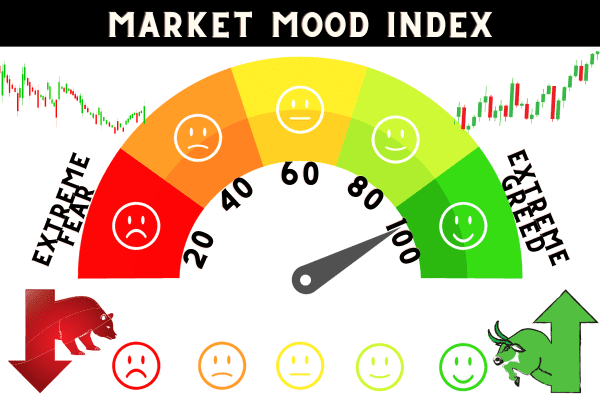
. Extreme Fear (0-20 ): A score of 0–20 indicates that the majority of market participants are risk-averse and negative. They might be worried about several things, such as geopolitical unrest, economic volatility, or other big unknowns. A rating of 0 to 20 would suggest that traders and investors are very fearful and pessimistic. Severe fear readings may be considered contrarian signals. This implies that a very negative attitude could be an indication of a possible market-turning moment. In the past, there have occasionally been market recoveries following moments of great fear.
. Fear ( 20-40 ): It represents a moderate level of dread in the market when seen in the context of a mood indicator that rates fear on a scale from 20 to 40. A rating of 20 to 40 indicates that traders and investors are not extremely fearful, but they are somewhat afraid. Though they might not be as noticeable as they were during times of acute anxiety, worries and doubts might nonetheless exist in the market.
. Neutral ( 40-60 ): It denotes a generally neutral and balanced feeling in the market when seen in the context of a sentiment indicator that rates neutrality on a scale from 40 to 60. A reading ranging from 40 to 60 indicates a largely neutral attitude among traders and investors. This indicates that neither a major bias in favour of bullish nor bearish views exists. The market may be in equilibrium.
. Greed ( 60-80 ): A rating ranging from 60 to 80 indicates a notable level of confidence and optimism among traders and investors. They can have a greater propensity for taking chances and adopting bullish tactics. Market players may fervently believe in the market’s upward potential when they are acting greedily. Positive economic data, business profit reports, or other advantageous circumstances may be the driving forces behind this.
Greed can occasionally result in market overextension, as prices detach from underlying fundamentals. This could raise the possibility of a future adjustment. It’s critical to keep up with pertinent financial and economic news, even in an avaricious market. It’s also critical to continue to be disciplined in your approach to investing.
Extreme Greed ( 80-100 ): A rating of 80–100 indicates that traders and investors are displaying unusually high levels of optimism and confidence. There is a strong conviction that the market has upward potential. Extreme greed can lead to a state of market exuberance, where there may be a disconnect between prices and underlying fundamentals. This can increase the risk of a potential market correction or even a bubble in certain asset classes.
A “fear of missing out” (FOMO) attitude and speculative behaviour can coexist with extreme levels of greed. When it comes to excessive speculation and possible bubbles in specific asset classes, investors need to exercise extra caution. It is recommended to get advice from a knowledgeable financial advisor who can provide individualized guidance based on your unique financial status and aspirations, given the increased danger associated with extreme greed.

Use The (MMI) In Your Investment Strategy:
. Contrarian Strategies: Think about defying the popular opinion. For example, it could be a good idea to search for buying opportunities if the MMI shows significant anxiety.
. Use As a Conformation Indicator: Use the MMI to validate the analysis you’ve already done. Your confidence in the trade may increase if your technical and fundamental analysis agrees with the MMI.
. Risk Management: Risk management is a main part of the share market if you strictly manage your risk ( risk to reward ratio ) per day profit loss as per your capital percentage. so your success rate will increase soon if you are a profitable trader or investor. Extreme greed on the MMI may foreshadow an approaching correction, so proceed with caution. Modify the allocation of your portfolio and think about putting preventative measures in place. Recall that there is no one-size-fits-all strategy for risk management; instead, plans should be customized to meet the goals and conditions of each unique situation. Furthermore, there is always some risk in the financial markets, therefore it’s critical to balance the two.
1. Volatile nature: The MMI is a dynamic indicator that is subject to quick changes in reaction to news releases, market events, and economic data. Short-term market movements can be significantly impacted by abrupt changes in attitude.
2. Complementary Tool: The MMI is a useful tool, but it works best when combined with other indicators and analytical techniques. For a more thorough understanding of the market, sentiment analysis can be combined with technical and fundamental analysis.
3. Behavioral Principles in Finance: The behavioural finance theory that underpins the MMI acknowledges that psychological biases impact investor behaviour. Knowing these biases—like overconfidence or excessive fear—can help develop contrarian tactics by revealing important information.
4. MMI Not a Crystal Ball: The MMI is not a crystal ball, even though it can provide insightful information. The state of the market is only one component of the jigsaw; it does not predict future events. The behaviour of markets can be influenced by structural, geopolitical, and economic variables.
5. Use MMI In Different Markets: It is possible to modify the MMI for many financial markets, such as stocks, bonds, currencies, and commodities. Variants could concentrate on particular asset classes or geographical areas.
Conclusion: By offering insightful information on investor sentiment, the Market Mood Index assists market participants in making better decisions. Portfolio resistance to market volatility can be improved by implementing customized risk management methods based on the current emotion.
The Market Mood Index can help traders and investors navigate market volatility more confidently when combined with sensible risk management strategies. Remember, investing and trading always carry risks, and there are no guarantees of profit. It’s important to approach the market with a well-informed and disciplined strategy. If you’re considering making investment decisions based on sentiment indicators, it’s a good idea to consult with a financial advisor or conduct thorough research before taking action.
FAQ
Is the Market Mood Index a reliable predictor of market movements?
Even though the Market Mood Index might offer insightful information about emotion, it’s crucial to remember that no one indicator is infallible. It ought to be applied in concert with additional risk management and analysis.
How frequently is the Market Mood Index updated?
The Market Mood Index may be updated more or less frequently based on the platform or company that provides it. While certain indexes might update every day, others might update on a different timetable.
Where can I find the Market Mood Index for a particular asset class or market?
The Market Mood Index may not always be available, based on the financial platform or institution. Usually, trustworthy financial news websites, trading platforms, or specialist financial data sources carry it.
What possible drawbacks might there be to using the Market Mood Index as a sole source of market data?
The Market Mood Index has its limitations, just like any other emotion indicator. In some market circumstances, it may give erroneous indications, so it’s crucial to take other aspects into account in addition to the index.
what is the market mood index?
Also known as the Investor Emotion Index or the Fear-Greed Index, the Market Mood Index is a quantitative measure of market emotion. It is an expression of the thoughts and sentiments that investors have in general on the financial markets. The MMI provides a fast evaluation of the excessive fear or greed in the market.


